What nsSNPAnalyzer does?
nsSNPAnalyzer is a tool to predict whether a nonsynonymous single nucleotide polymorphism (nsSNP) has a phenotypic effect. nsSNPAnalyzer also provides additional useful information about the SNP to facilitate the interpretation of results, e.g., structural environment and multiple sequence alignment. nsSNPAnalyzer uses information contained in the multiple sequence alignment and information contained in the three dimensional protein structure to make predictions. It was known that combining the two independent sources of information improves the prediction accuracy [1]. We compared the performance of nsSNPAnalyzer with other applications and the result can be found here. The false positive rate is 38% and the false negative rate is 21%
How does nsSNPAnalyzer work?
nsSNPAnalyzer uses a machine learning method called Random Forest to classify the nsSNPs. It was trained using a curated SNP dataset prepared from the SwissProt database. nsSNPAnalyzer calculates three types of information from the user's input: 1) the structural environment of the SNP, including the solvent accessibility, environmental polarity and secondary structure [2]; 2) the normalized probability of the substitution in the multiple sequence alignment [3]; 3) the similarity and dissimilarity between the original amino acid and mutated amino acid.
Input for nsSNPAnalyzer
The minimum input includes a protein sequence in FASTA format
and a substitution file denoting the SNP identities to be analyzed.
Substitution file format: A substitution is denoted as X#Y where X is the original amino acid in one letter, # is the position of the substitution (starting from 1) and Y is the mutated amino acid in one letter. Multiple substitutions should be separated by new line characters. Example:
R14P
K130T
K130F
On receiving these two inputs, nsSNPAnalyzer will search the ASTRAL database for homologous protein structures subjected to some criteria.
The users may also submit their own protein structure file in PDB format. In this case, the users should also indicate which chain they would like to be used for calculation. If there is only one chain in the PDB file, please select the character of "_".
Output for nsSNPAnalyzer
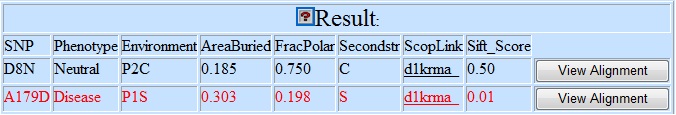
Sample output:
|
Field Name |
Meaning |
|
SNP |
The input SNP identity. |
|
Phenotype |
The prediction: "Disease", "Neutral" |
|
Environment |
The structural environment of the SNP calculated by the "environment" program [2]. The SNP is assigned to one of 18 environments: B1H, B1S, B1C, B2H, B2S, B2C, B3H, B3S, B3C, P1H, P1S, P1C, P2H, P2S, P2C, EH, ES and EC*. |
|
AreaBuried |
Solvent accessibility score[2]. |
|
FracPolar |
Environmental polarity score[2]. |
|
Secondstr |
Secondary structure. H: alpha-helix, S: beta-sheet, C: coil |
|
ScopLink |
Link to the homologous 3D structure (SCOP entry) |
|
SIFT_score |
Normalized probability of the substitution calculated by the SIFT program [3]. |
*The first character denotes the solvent accessibility B: buried, P:
partially buried, E: exposed. The second
number (if exists) denotes different environmental polarity provided the
solvent accessibility is the same, with a larger number corresponding to a
larger polarity. The last character denotes the secondary structure.
The user can click the "View Alignment" button to see the local sequence alignment spanning the substitution sites. The original amino acid is highlighted in blue, and the mutated amino acid is highlighted in red.
Occasionally, the structural environment of a nsSNP can not be calculated due to missing atom coordinates and/or aberrant structure in the PDB file. In such cases, nsSNPAnalyzer only reports the multiple sequence alignment result.
Reference
[1] [1] Saunders CT, Baker D. Evaluation of
structural and evolutionary contributions to deleterious mutation prediction. J
Mol Biol. 2002 322:891-901
[2] [2] Bowie JU, Luthy R, Eisenberg D. A
method to identify protein sequences that fold into a known three-dimensional
structure. Science. 1991 253:164-70
[3] Ng PC, Henikoff S. Predicting deleterious amino acid substitutions. Genome Res. 2001 11:863-74